The HERMOSA platform has many nifty features when it comes to importing, analysing and managing geodata. They were explained in previous contributions and can be found in the news section of our homepage. Each one of them is important in itself but the end-point of many activities is the communication about the overall achievement. In most cases this requires several data sets, like maps, graphs, text, tables, and images. Our reporting module is the place to visit when it comes to generating such comprehensive documents. Importantly you can create a map report and a statistics report. The latter gathers geostatistical information generated while analysing satellite data. But let’s take a look at the map report first:
As soon as satellite data has been analysed, project geometries have been uploaded or external data has been incorporated they show up in the layer tree. Here they can be shown or hidden to be viewed in context with other data. The visibility is also the switch to determine whether they get used in the report or not. This way you can interactively compose the geographical contents of your later exported maps.
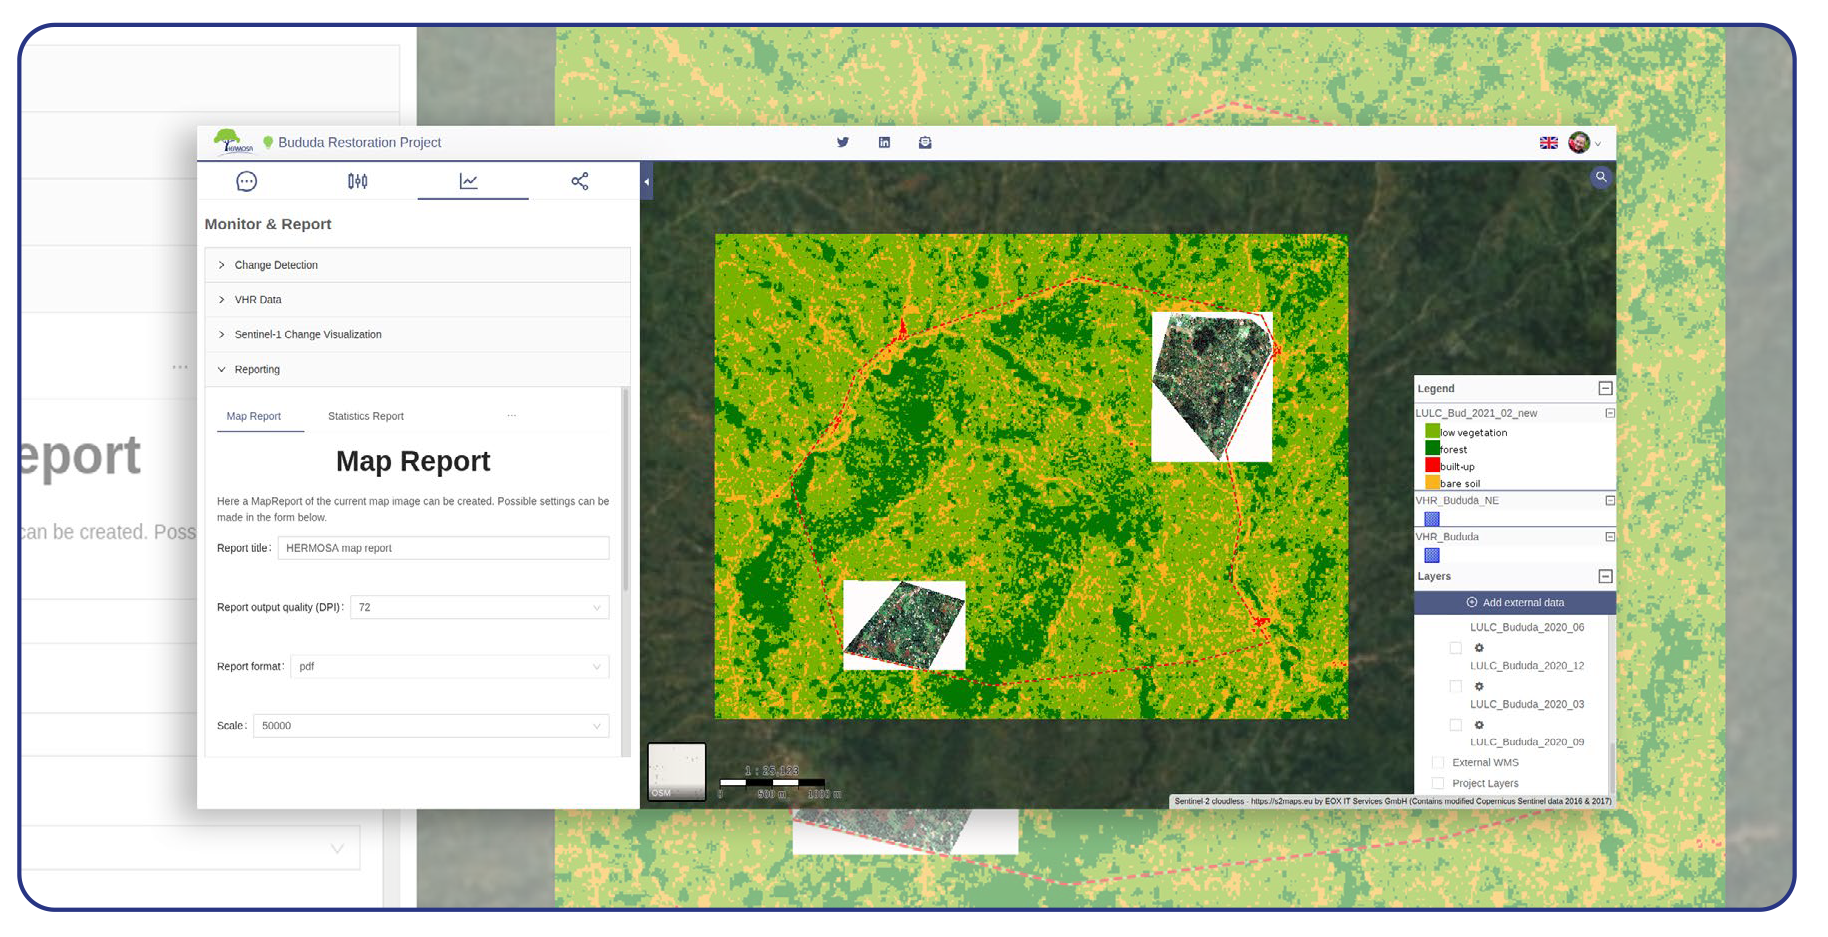
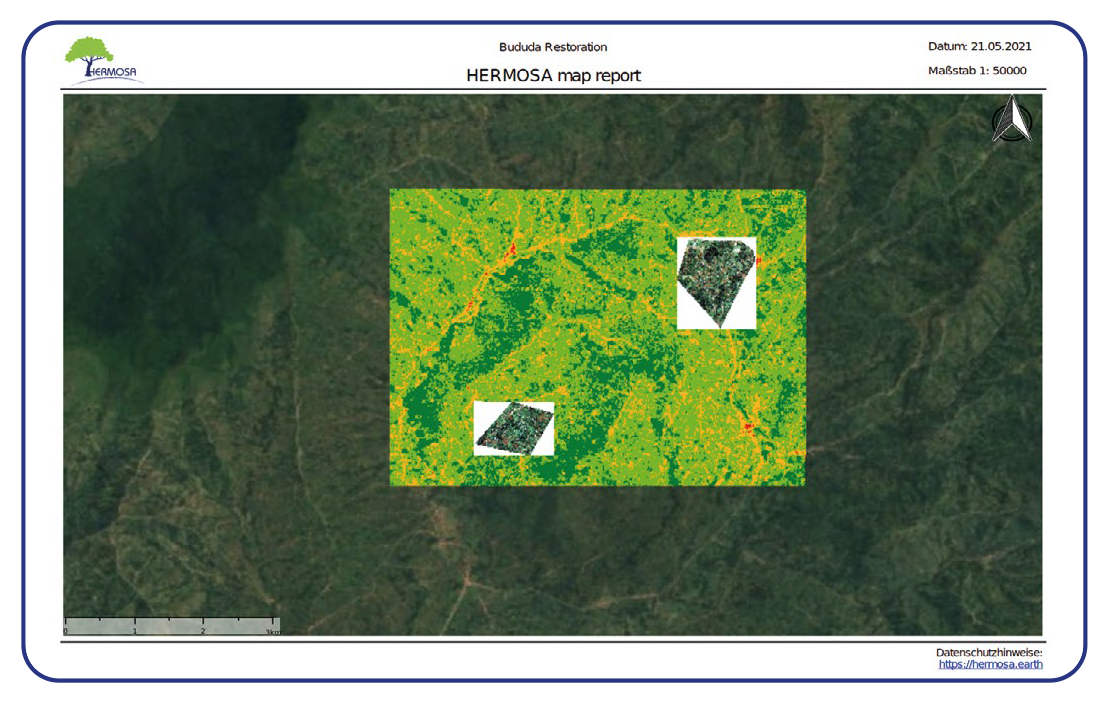
The process of actually generating a map report is easy. You select the data layers you would like to see in the report and choose the zoom level and location. When you click on Map Report a bounding box is drawn on the map which indicates the section of the map that will be printed into the report. After optionally choosing the report output quality, the report format, the scale and the layout you can also determine if you would like to print a legend, scale bar or north arrow. You also have the option to add individual notes. When you hit the ‘download’ button the server creates a PDF which contains the maps you previously decided on. The map report can now be fed into third-party applications like document management systems or editing tools, it can be printed, filed away or handed out. Information and insight from HERMOSA doesn’t stay there, because we understand that the resulting maps should be usable in a multitude of ways.
The statistical report is also accessed through the reporting module. For it to work you need to activate at least one layer which was previously calculated. Right now, it will not work on uploaded project layers because geostatistics were not calculated in this case. We are still evaluating whether we can make statistics stemming from these datasets available and exportable. Future versions of HERMOSA might bring changes here. Back to what we can do today: In HERMOSA it is possible to analyse Sentinel data of various kinds, for example to get insights into land use / land cover classifications and changes in time of this topic.
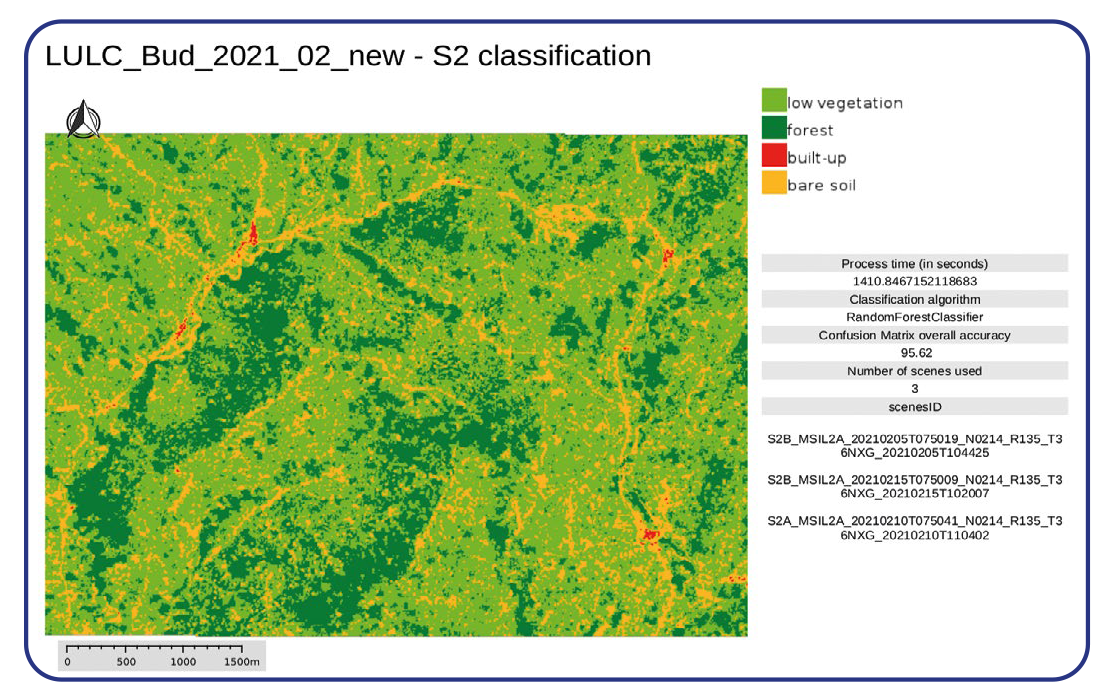
While the result of these calculations is put into the report, it is sometimes important to get more statistical figures about the processed information. Therefore – depending on the topic we report on – we include the processing time, identifiers & total number of used datasets / scenes and also quality indicators like accuracy into the statistics report. For certain reports we also produce a tabular overview of the classification result. This way you can, for example, see how many percent of the chosen area were classified into one of the target classes and also how this has changed over time. The possibilities are endless.
We know that reporting of gathered insights either for further processing, taking action or fundraising is a crucial part of HERMOSA: thanks to reporting, a user can document progress as well as support ecosystem restoration processes on many levels. A lot is already possible, thanks to the flexible reporting tools. We would nonetheless love to hear of more of your specific needs when it comes to reporting. Make sure to tell us what you need, we surely value any feedback or wishes you express to us.
Contact sales@hermosa.earth today to get started!